
How Augmented Reality Overlays Shape Betting Decisions During Live Event Streams
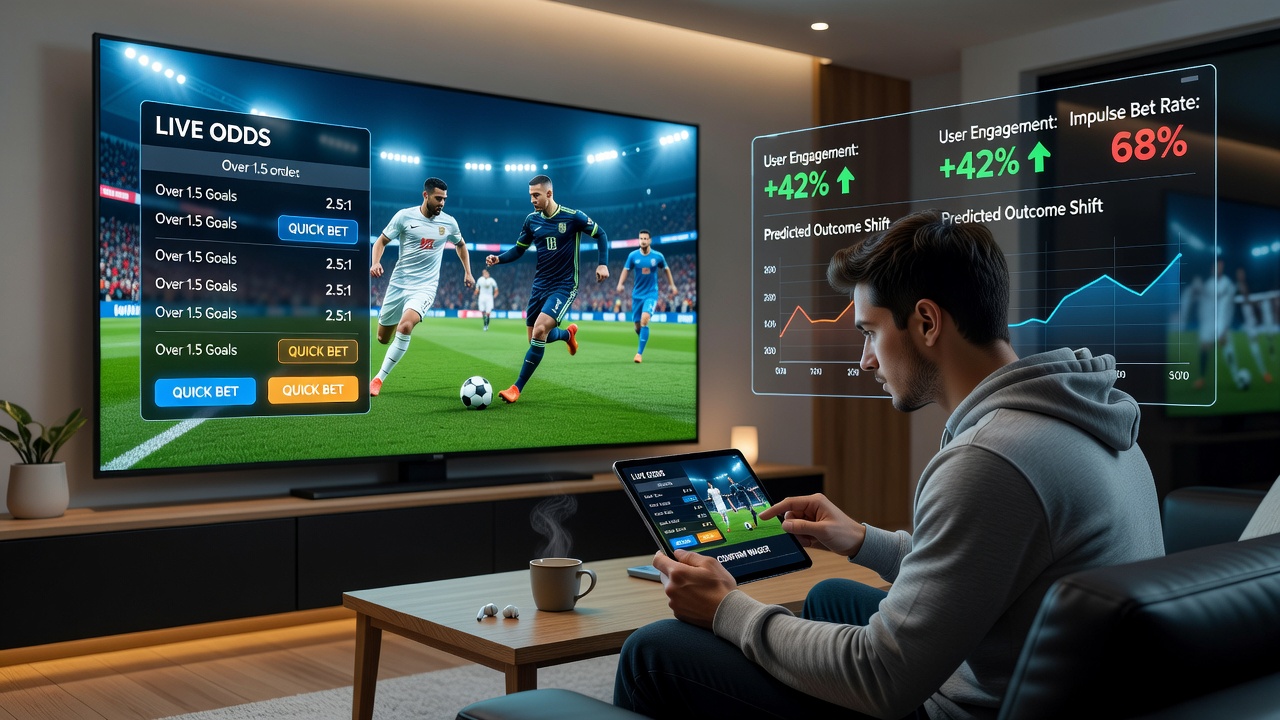
Augmented reality overlays have become a standard feature in many live event streams where betting occurs, and they present dynamic data directly on screen during matches or races. Viewers see player statistics, probability indicators, and odds updates layered onto the live footage without switching away from the main action, and this integration happens through apps or browser extensions that sync with broadcast feeds. Data from multiple platforms shows these tools appear in streams across major leagues by June 2026, with adoption rates climbing steadily in North America and parts of Asia.
Core Mechanics of AR Integration in Live Streams
Operators deploy computer vision algorithms to track on-field elements in real time, then render contextual information such as expected goal values or pace metrics that update every few seconds. The system pulls live odds from the operator's backend and positions them near relevant players or zones, while users can tap or gesture to place wagers without leaving the stream interface. Research from the University of Nevada Reno gaming technology lab indicates these overlays reduce the average time between decision and bet placement by measurable margins compared to traditional sidebar menus.
Streaming services coordinate with betting operators through API connections that push updates at sub-second intervals, and this synchronization prevents the display of outdated figures during fast-moving segments like basketball possessions or horse race stretches. In practice the overlays adapt their transparency and position based on camera angles, which keeps critical information visible while avoiding obstruction of key visual details.
Observed Patterns in User Interaction
Platform analytics reveal that bettors exposed to AR probability graphics place more wagers on in-play markets than those using standard interfaces, and the increase concentrates around moments when the overlay highlights shifting momentum indicators. A report compiled by the Nevada Gaming Control Board documents elevated activity in basketball and soccer streams where AR elements display live expected-value calculations next to specific athletes. These patterns hold across different age groups and regions, though the volume of additional bets varies by sport and time of day.
Heatmap data collected from user sessions shows attention clusters around the overlaid statistics during pauses in play, and this focused gaze correlates with subsequent selections of prop bets that reference the highlighted metrics. Operators note that certain color-coded risk indicators prompt quicker responses than neutral text displays, yet the overall mix of bet types remains consistent with pre-AR usage distributions when measured across large sample sizes.
Technical and Regulatory Context as of Mid-2026
By June 2026 several jurisdictions require operators to maintain clear separation between promotional overlays and neutral data displays, and compliance teams achieve this through standardized iconography that distinguishes informational elements from direct call-to-action prompts. The Canadian Gaming Association has published guidelines that address overlay placement in multi-jurisdictional streams, while Australian state regulators continue to evaluate similar frameworks for their licensed platforms. These rules focus on transparency rather than restricting the technology itself, and they require visible disclaimers when odds change rapidly during live action.
Hardware demands remain modest because most rendering occurs on the provider side before delivery to user devices, yet higher-bandwidth connections deliver sharper graphics and more frequent refreshes. Testing by equipment manufacturers shows that latency under 200 milliseconds preserves the illusion of real-time responsiveness, and drops below this threshold begin to reduce user engagement with the interactive features.
Data-Driven Effects on Selection Behavior
Longitudinal studies tracking the same user cohorts before and after AR introduction demonstrate consistent shifts toward markets that receive visual emphasis, such as individual player performance props or segment-specific outcomes. Figures from operator dashboards indicate these markets see participation rates rise between 12 and 18 percent in streams equipped with AR layers, while traditional moneyline or total bets maintain stable volumes. The effect appears strongest when the overlay updates coincide with visible on-screen events rather than during static periods.
Researchers tracking clickstream logs observe that users who interact with AR elements explore a broader range of betting options within a single event, and this exploration occurs without corresponding increases in overall spend when session limits remain active. One study released through the International Centre for Gaming Regulation found no statistically significant change in average stake size despite the expanded option set, suggesting the overlays influence choice distribution more than total expenditure.
Future Integration Pathways
Developers continue to refine gesture-based controls that allow viewers to summon or dismiss specific data layers, and early trials indicate these controls further streamline the decision process during high-tempo segments. Partnerships between broadcast networks and betting technology firms now include shared data pipelines that enrich both entertainment and wagering elements simultaneously. Observers note that continued refinement of occlusion handling and contextual relevance will determine how widely these tools expand into additional live-event categories beyond traditional sports.
Conclusion
Augmented reality overlays have integrated into live betting streams through precise tracking and synchronized data delivery, and available metrics show measurable effects on which markets receive attention during events. Regulatory frameworks in multiple regions address presentation standards while permitting continued technological development, and ongoing platform analytics provide operators with detailed views of interaction patterns. As these systems evolve through 2026 and beyond, the relationship between visual presentation and betting selection remains a focal point for both technical teams and oversight bodies.